Note: this article is the writers personal opinion. It is based upon almost 40 years of experience in small computers and communications, but it is still an opinion.It is presented AS IS. All use is at your own risk.
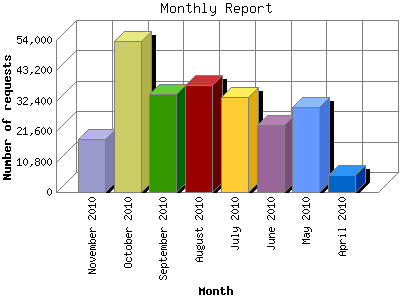
We ran web stats tonight, using access logs from April through October 2010. They are self explanatory and follow. The trend — rising or falling market share — is more important than calculated percentage. The year to year trend will be accurate even if the accuracy of the market share assessment is approximate.
IF we ASSUME that all “unknown” OSes are in fact Microsoft (for example Vista or Windows 7) then Microsoft is still level at 60% of market share (compared to our Operating System use check October 2009). They are down 30% from their 90% market share eight years ago, which explains their more aggressive pricing (they cut the price of Windows 7 in half compared to Vista and Windows XP). Linux is at 27.34% down 1.81% from last year’s 29.15%. MAC is at 4.46% down 3.48% from last year’s 7.94%. In all the Windows 7 platform may have attracted a few people, but it must have drastically disappointed shareholders. Apparently businesses who were driven away over eight years of Microsoft hubris are less than willing to jump back into the frying pan after biting the bullet and switching to MAC or Linux.
Comparing to Web Browser use stats from October 2009, the most significant change in Web Browser use goes to the Safari camp, which won market share up 17.58% at 26.88% over use of 9.3% reported last October. Safari numbers may actually include users adopting the Google Chrome (or Chromium) platform for web browsing — GoDaddy.com‘s statistics service does not distinguish. Since use of MAC OS has actually dropped, and Safari is primarily used in conjunction with MacOS, the most logical conclusion is that Google Chrome now has taken roughly 20% market share, possibly fueled by consumer privacy and business security concerns which discourage adoption of IE, promotion of Chrome by Industry giant Google.com, and the overwhelmingly extreme acceptance of the Android (Linux) powered ‘Droid series of Smart Phones, which are the established mobile phone market leader.
Microsoft IE is off (down) exactly 8% at 28.72% from last October’s 36.72%. FireFox is off 25.03% at 15.00% down from last year’s 40.03%. Opera, the intensely standards compliant browser used mostly by those who value such things is off 0.36% at 0.86% of market share, down from 1.22% last year.

| Operating System used to access Nash group of web sites | |||||||
| Sites are unpromoted: that is no significant advertising or link sharing is allowed so that the site can only be accidentally (randomly) discovered and does not attract people interested in any particular specialty, such as people who like a particular browser or operating system. Last full month is October 2010. | |||||||
| Operating System | Number of requests | Number of page requests | Percent of OS | Percent of use | |||
| 1 | Windows | 94,770 | 29,840 | 39.93% | 37.02% | ||
| Windows XP | 54,481 | 21,660 | 57.49% | 72.59% | |||
| Unknown Windows | 35,367 | 6,375 | 37.32% | 21.36% | |||
| Windows Server 2003 | 2,076 | 612 | 2.19% | 2.05% | |||
| Windows 2000 | 1,324 | 528 | 1.40% | 1.77% | |||
| Windows NT | 678 | 259 | 0.72% | 0.87% | |||
| Windows ME | 259 | 164 | 0.27% | 0.55% | |||
| Windows 98 | 200 | 112 | 0.21% | 0.38% | |||
| Windows 95 | 287 | 92 | 0.30% | 0.31% | |||
| Windows CE | 74 | 26 | 0.08% | 0.09% | |||
| Windows 3.1 | 24 | 12 | 0.03% | 0.04% | |||
| 2 | OS unknown | 47,692 | 29,582 | 20.10% | 36.70% | ||
| 3 | Known robots | 19,373 | 10,703 | 8.16% | 13.28% | ||
| 4 | Unix | 64,895 | 8,809 | 27.34% | 10.93% | ||
| Linux | 64,893 | 8,808 | 99.9969% | 99.9886% | |||
| BSD | 2 | 1 | 0.0031% | 0.0015% | |||
| 5 | Macintosh | 10,587 | 1,665 | 4.46% | 2.07% | ||
| 6 | Symbian OS | 13 | 2 | 0.01% | 0.00% | ||
| Total Use | 237,332 | 80,603 | 100.00% | 100.00% | |||

| Browser used to access Nash group of web sites | |||||||
| Sites are unpromoted: that is no significant advertising or link sharing is allowed so that the site can only be accidentally (randomly) discovered and does not attract people interested in any particular specialty, such as people who like a particular browser or operating system. Last full month is October 2010. | |||||||
| Browser Type | Number of requests | Percent of use | |||||
| 1 | MSIE | 68,158 | 28.72% | ||||
| 2 | Safari | 63,797 | 26.88% | ||||
| 3 | Firefox | 35,609 | 15.00% | ||||
| 4 | Netscape (compatible) | 32,261 | 13.59% | ||||
| 5 | msnbot | 6,265 | 2.64% | ||||
| 6 | Mozilla | 3,652 | 1.54% | ||||
| 7 | Yandex | 2,893 | 1.22% | ||||
| 8 | Googlebot-Image | 2,777 | 1.17% | ||||
| 9 | WordPress | 2,713 | 1.14% | ||||
| 10 | Baiduspider+(+http: | 2,160 | 0.91% | ||||
| 11 | Java | 2,048 | 0.86% | ||||
| 12 | Opera | 2,037 | 0.86% | ||||
| 13 | Sogou web spider | 1,336 | 0.56% | ||||
| 14 | panscient.com | 1,166 | 0.49% | ||||
| 15 | LinkedInBot | 1,012 | 0.43% | ||||
| 16 | NextGenSearchBot | 771 | 0.32% | ||||
| 17 | Sosospider+(+http: | 725 | 0.31% | ||||
| 18 | http: | 595 | 0.25% | ||||
| 19 | TwengaBot-Discover (http: | 497 | 0.21% | ||||
| 20 | AdsBot-Google (+http: | 496 | 0.21% | ||||
| [not listed: 189] | 6,362 | 2.68% | |||||
| Total Use | 237,330 | 100.00% | |||||
Note: this article is the writers personal opinion. It is based upon almost 40 years of experience in small computers and communications, but it is still an opinion.It is presented AS IS. All use is at your own risk.